Attendance Forecast Check-In (Halfway Point)
We're halfway through the Minnesota State Fair. Let's see how the forecast is doing.
Notes from the Halfway Point
If you haven’t already, check out our progress on the updated daily Minnesota State Fair attendance forecast!
Midway through the forecast, and I’ve learned a lot. Definitely some surprises, but I’ve looked it over and decided that I’m going to let it ride. Here are some highlights so far.
Leading Off with a Bang!
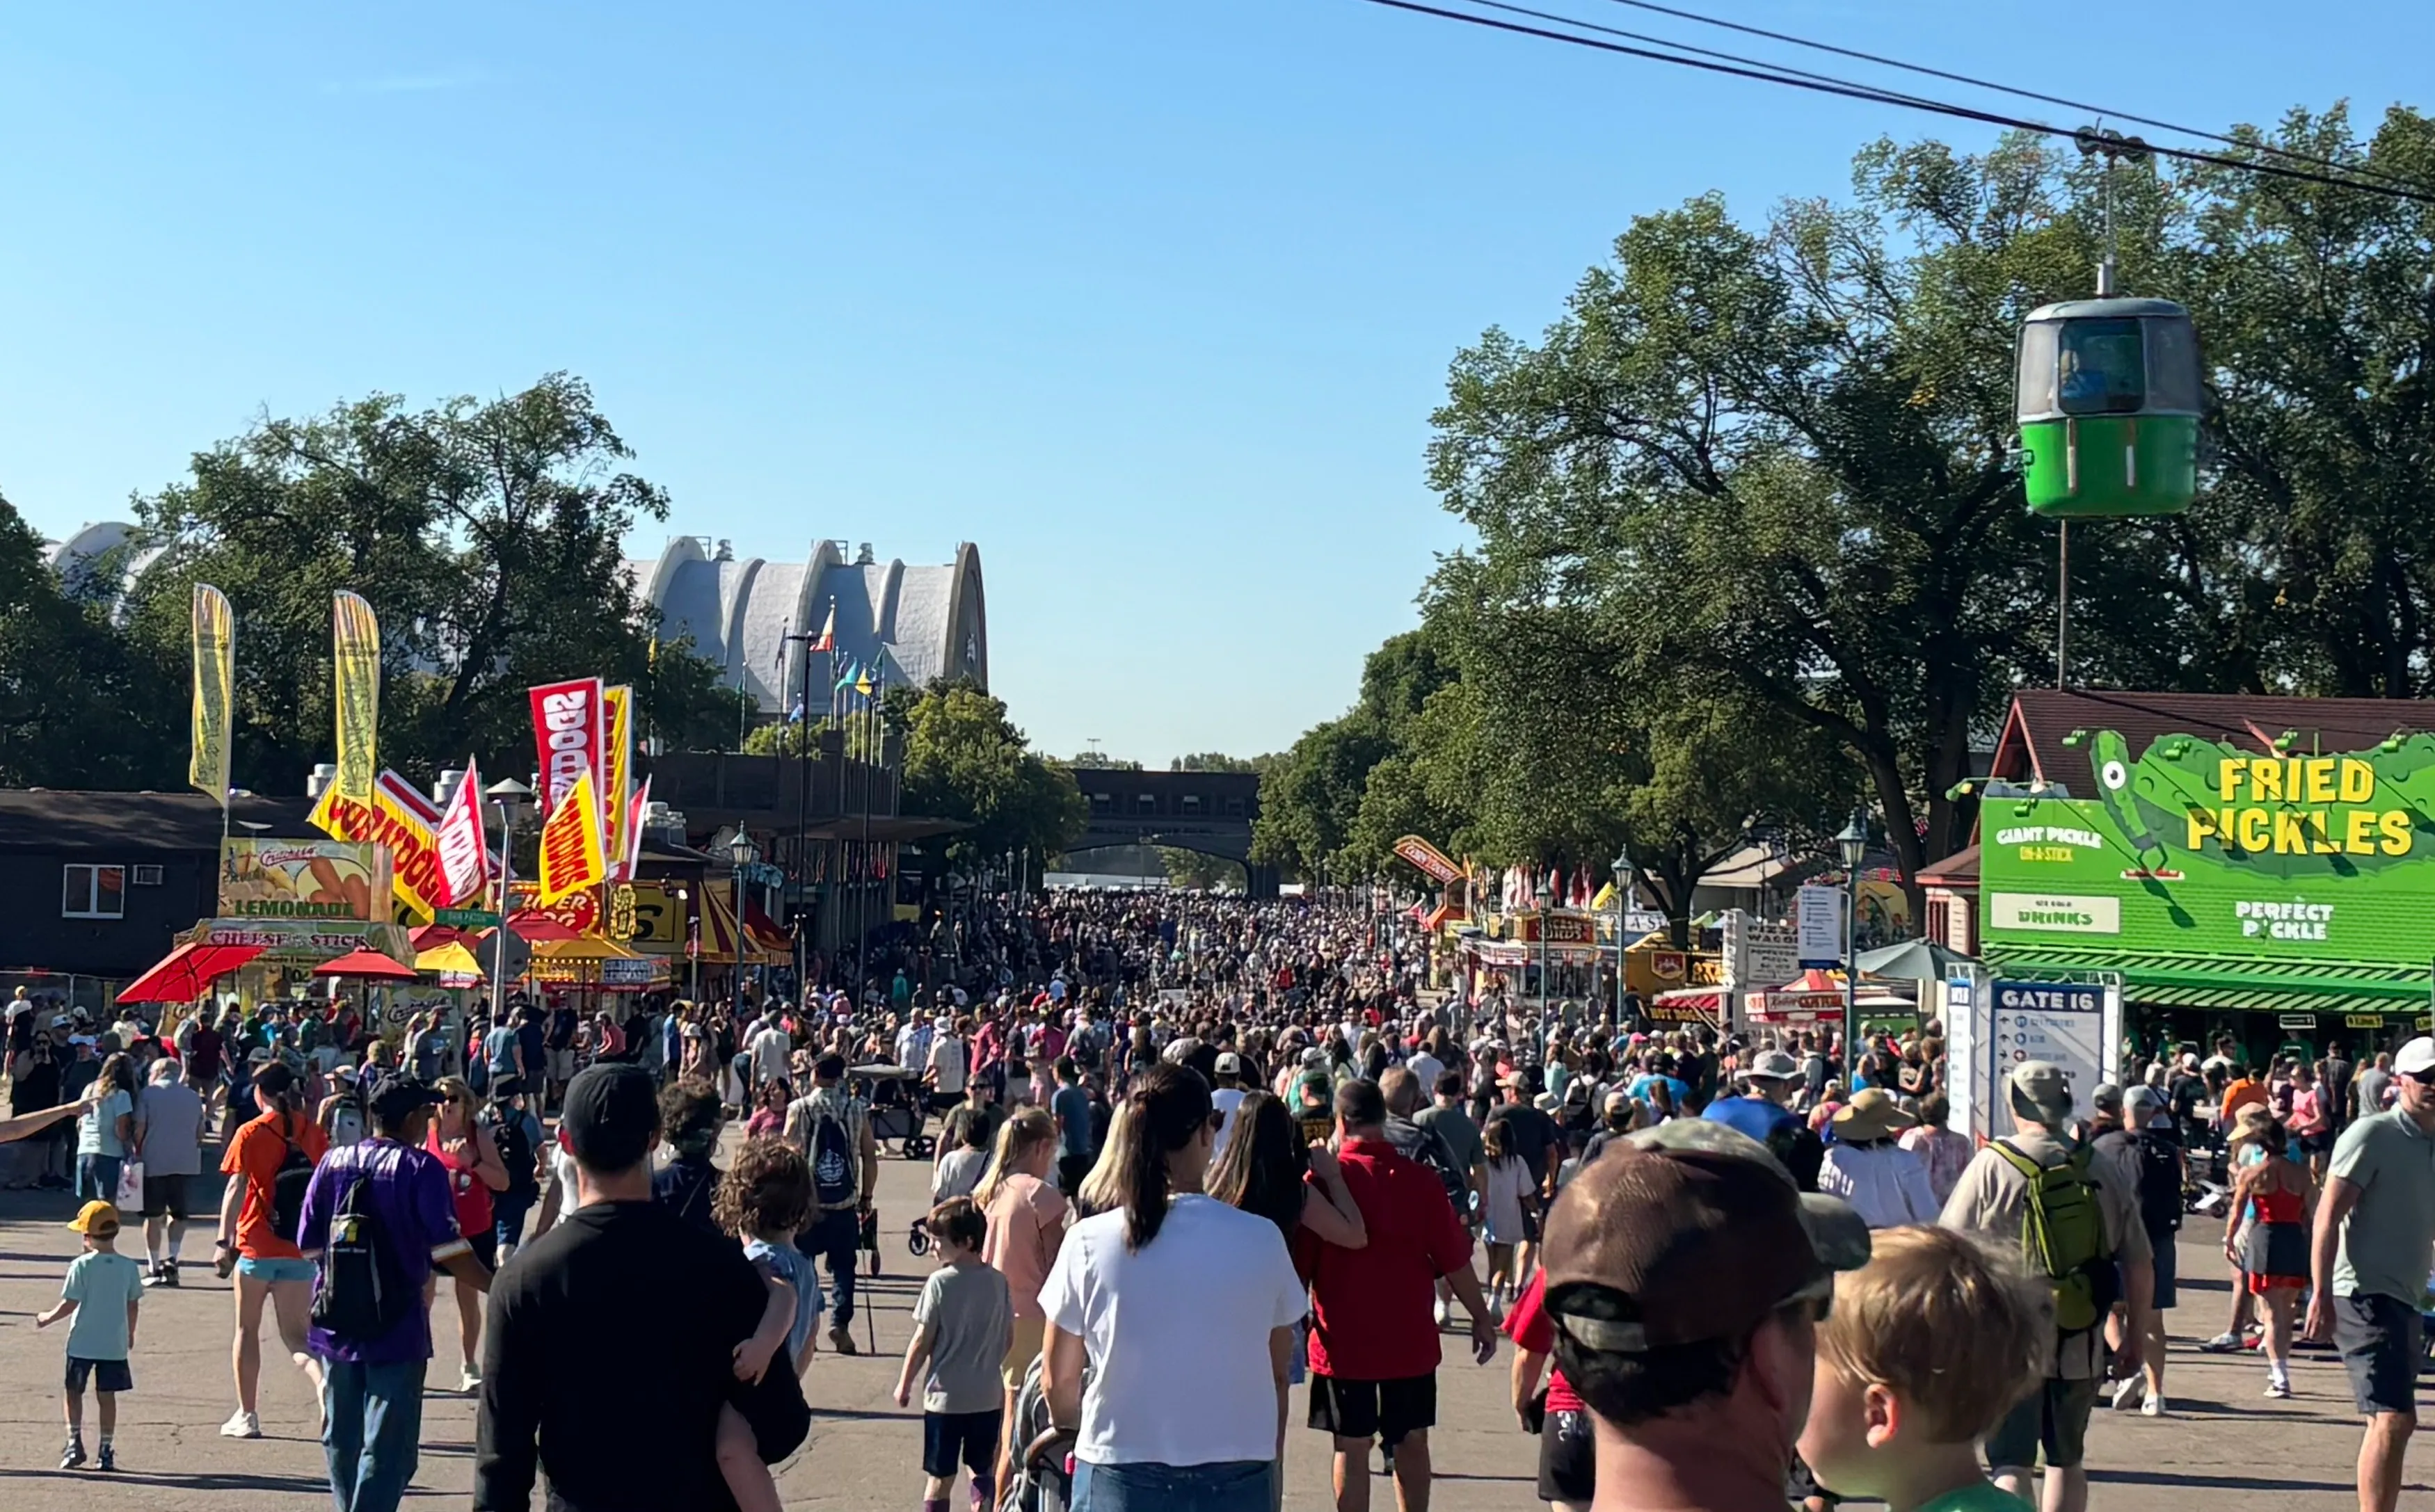
I forecasted that the first Friday would break the all-time record for the day, and it ended up blowing the record out of the DNR fish pond. The previous record for the first Friday was just set in 2024 at 171,233, which is a 17% difference from the new record of 204,065. Quite a record!
The early school start for suburban school districts had a different impact than I expected early on, where as I expected the weekends to see larger upticks from this. As we arrived at the busy Park N’ Ride and fair on Friday (Day 2) morning, it was fun (and stressful) hearing people speculating that the first two days would be really busy because of the early school start. I can say as someone who went on the same day last year, it was an exceptionally busy first Friday!
Notable lesson here…
Even though I knew that schools were starting earlier this year, I applied that knowledge incorrectly to the forecast. It’s not just about having the information; you have to know how to apply it to your decision-making process.
Even with all that, I’m sticking with my forecast to see how this plays out. I still expect the total attendance to reach 2 million, and I’m rootin’ for it!
Questions we’re asking right now…
As you rightfully judge my daily event forecasting abilities, please be assured that I’m learning a lot about my previous assumptions used to make my forecast.
For instance, the weather forecasts have changed a lot since I worked on my attendance forecast. How can I use the most accurate weather forecasts for the 2027 version? Sunday (Day 11) and Monday (Day 12) are now showing rain as the primary icon for the day. How does that impact attendance? Do people click into their weather app to investigate the weather further? Do they quickly decide that Saturday (Day 10) will have to be the day they go to avoid rain? When do they make that decision during the week?
And that’s just the potential impact from the weather. Many other forces could impact the attendance. For 2027, we’re already considering other pieces of information to bring into the forecast analysis, such as the population of Minnesota, ticket prices, and Grandstand shows. Finding and bringing in new information to influence a decision might not always be worth the time and effort to collect and understand that information.
This is part of the decision-making process in general. What information do you need to see to reduce your uncertainty in the decision? This is not to say that you should just gather the information that supports an opinion. You should gather information to help you answer a question.
Thanks for following along with the forecast! Keep checking back at our updated Forecast and blog for deeper analysis as we learn more about the Minnesota State Fair.